Reading and Drawing Distance-Time Graphs
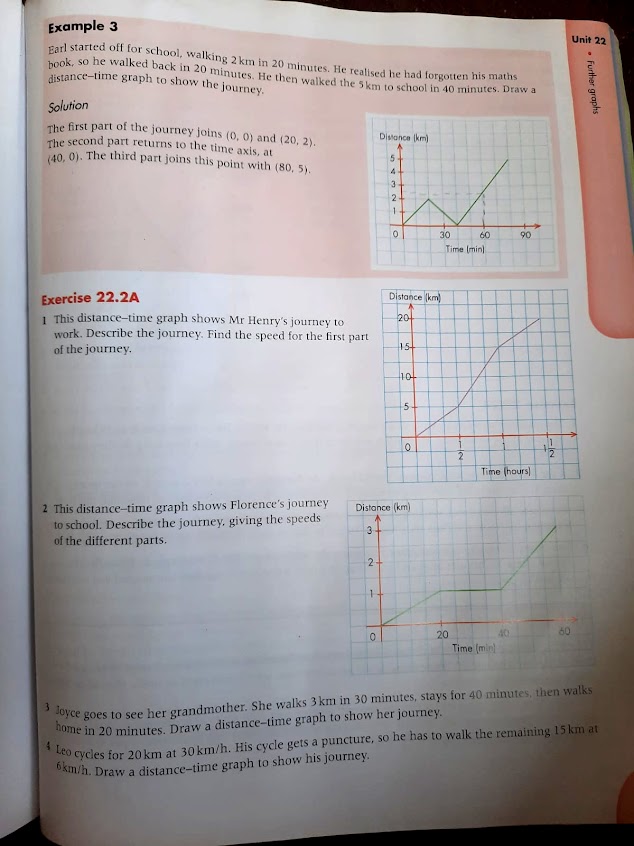
A graph showing time along the horizontal axis and distance on the vertical axis is a distance-time graph. A distance-time graph illustrates a journey.
This one shows that a journey of 6km took 1.5 hours. The slope of the graph is the distance divided by time, that is the speed.
Speed= 6 ÷ 1.5 = 4km/h
The distance-time graph shows Loretta's journey to school. Describe the journey. Find the speed of the first part of the journey.


Comments
Post a Comment